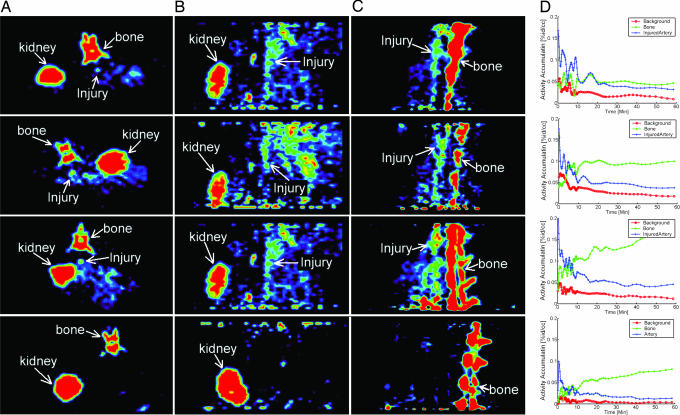
Fig. 3.
MicroPET images of the aorta acquired in the experimental atherosclerotic rabbit model (first through third rows) and in the normal control rabbit (fourth row) 30 min after injection of [18F]AppCHFppA (111 MBq) in an ear vein. Three-dimensional dynamic data were acquired in list mode for 1 h starting from the injection of the radiolabeled ligand. PET imaging studies were conducted with a microPET P4 system (Concorde Microsystems, Knoxville, TN). First through third rows, atherosclerotic rabbit model with activity distribution in (A) transverse view, (B) axial view, and (C) sagittal view, showing accumulation of radiopharmaceutical in injured artery and spine, and (D) time–activity curves indicating that the injured artery (blue) has enhanced accumulation compared with background (yellow). Fourth row, normal rabbit with activity distribution showing lack of accumulation of radiopharmaceutical in (A) transverse view, (B) axial view, and (C) sagittal view, and (D) time–activity curve of the radiopharmaceutical in artery (pink) and bone (blue). %id/cc, percentage injected dose per cubic centimeter.

