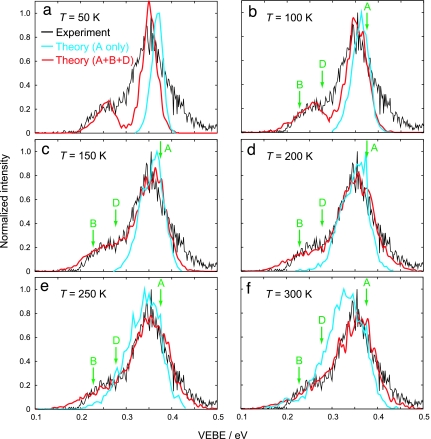
Fig. 3.
Experimental (5) photoelectron spectrum (black lines) and simulated spectra (colored lines) for (H2O)4−. (A low-intensity feature at 0.06 eV in the experimental spectrum, corresponding to isomer C, is not shown.) Shown in blue are spectra for isomer A only, in which the MP2/6-31(1+,3+)G* VEBEs are blueshifted by 0.031 eV, corresponding to the difference between MP2 and CCSD(T) VEBEs. Initial velocities for these trajectories are sampled from a Maxwell-Boltzmann (MB) distribution of rigid monomer rotations and translations, with no initial intramolecular velocity. Shown in red are spectra simulated for isomers A, B, and D, where the initial velocities were sampled from a MB distribution of nuclear velocities, and the resulting isomeric spectra are fit to experiment by using the model described in the text. Green arrows show the VEBEs calculated at the minimum-energy geometry of each isomer.

