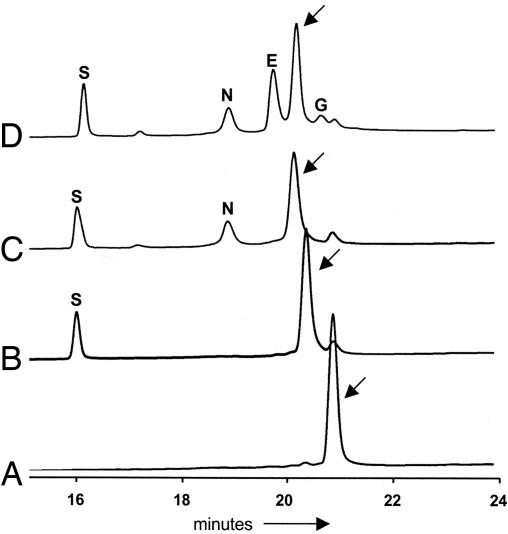
Fig. 3.
HPLC analysis of ZmaD. Representative HPLC traces of reaction mixtures containing apo-ZmaD (A); apo-ZmaD, Sfp (B); apo-ZmaD, Sfp, ZmaN (C); apo-ZmaD, Sfp, ZmaN, ZmaG, ZmaE (D). Protein elution was monitored at 220 nm. Arrows identify the peak associated with ZmaD derivatives, which were collected and analyzed by MS. The letters above absorbance peaks identify the elution of a protein from the reaction mixture: S, Sfp; N, ZmaN; E, ZmaE; G, ZmaG.

