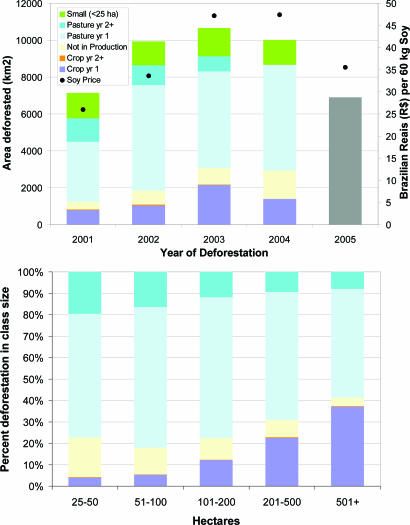
Fig. 2.
Trends in land use after 2001–2004 deforestation events >25 ha in Mato Grosso state, Brazil. (Upper) Summary of conversion dynamics by post-clearing land cover from satellite-based phenology information in the years after forest clearing. A preliminary estimate of 2005 deforestation is shown in gray (INPE PRODES). Inflation-adjusted prices per 60-kg sack of soybeans for the same period as the annual deforestation increment (September–August) are plotted on the right-hand axis in Brazilian Reais (R$).§§ (Lower) Fate of 2003 deforestation events by clearing size.

