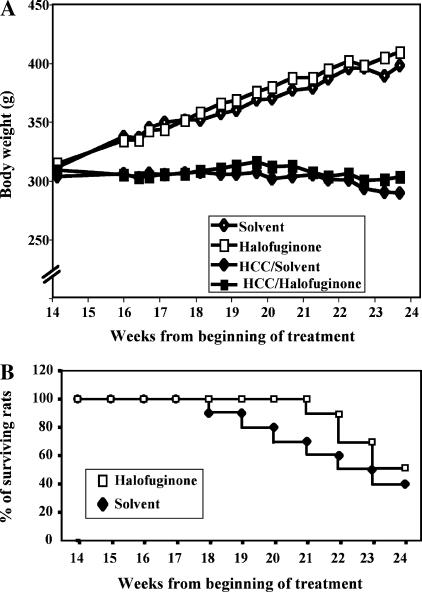
Figure 2.
Vital parameters. (A) Growth curve of animals. The curves begin on week 14, the time at which all animals bear HCCs and treatment with halofuginone or its solvent begins. Open symbols refer to animals that did not receive any carcinogens, whereas closed symbols refer to carcinogen-treated HCC-bearing animals. Standard deviations are not represented for the sake of clarity and were always < 12% of the mean. (B) Survival curve. This was also plotted starting from the beginning of treatment on week 14. The graph shows data only for HCC-bearing animals because there was no death in animals that did not receive carcinogens.

