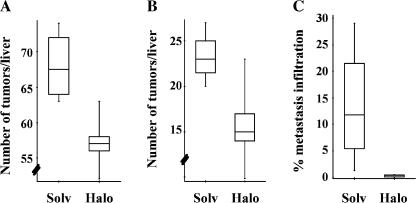
Figure 3.
Tumor burden. Tumor burden was evaluated at the time of sacrifice of surviving animals (solvent group, n = 4; halofuginone group, n = 5). (A and B) Box-and-whiskers plot of the number of nodules > 3 mm in diameter or > 6 mm, respectively. The top and bottom of each box represents the 75th and 25th percentiles, respectively. Whiskers represent the range, and the line in the box represents the median value of the distribution. The differences between the solvent and halofuginone groups were statistically significant in both cases using the Mann-Whitney test (P < .01 and P < .02, respectively). (C) The percentage of lung section surface infiltrated by metastasis was quantified as described in Materials and Methods section. The difference between groups was highly significant (P < .02; Mann-Whitney test).

