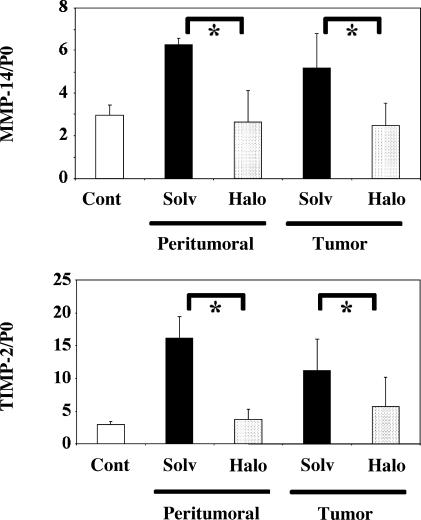
Figure 6.
The expression of transcripts of MMP-14 and TIMP-2 is reduced by halofuginone treatment. Transcripts of MMP-14 and TIMP-2 were assayed by quantitative PCR, and results were normalized according to the level of the P0 gene. Results are shown as mean ± SD. The upper panel shows MMP-14, and the bottom one shows TIMP-2. “Cont” refers to control animals that did not receive any carcinogens. “Solv” and “Halo” refer to animals bearing HCC that were treated with solvent or halofuginone, respectively. Measurements were made either in non-neoplastic parts of the liver or within tumors, as indicated. One-way analysis of variance showed that overall results differed significantly between groups (P <. 006 for MMP-14 and P <. 0003 for TIMP-2). Asterisks indicate significant differences between individual groups by post hoc Tukey's test (P < .01).

