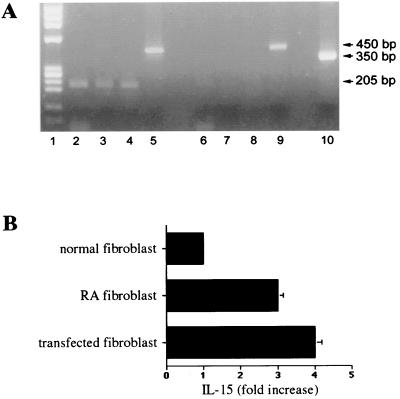
Figure 5.
(A) RT-PCR analysis of IL-6, IL-8, and IL-15 in wnt5a and pcDNA3 stable transfectants. Lane 1, DNA standard PhiX174; lanes 2–5, IL-6-, IL-8-, IL-15-, and G3PDH-specific PCR products from wnt5a stable transfectants; lanes 6–9, IL-6-, IL-8-, IL-15-, and G3PDH-specific PCR products obtained from pcDNA3 stable transfectants; lane10, wnt5a-specific PCR product (using wnt5a-specific and pcDNA3-bovine growth hormone-specific primers) obtained from wnt5a stable transfectant. (B) IL-15 protein expression in synovial fibroblasts. Bar graph showing fold difference in IL-15 protein levels in cell supernatants of RA, wnt5a-transfected, and normal synovial fibroblasts. This represents the average of three experiments. The baseline level of expression was estimated to be 60 pg/μg total protein by comparison with a known standard.

