Figure 4.
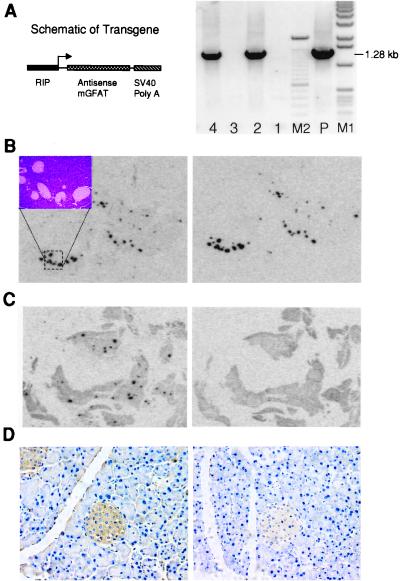
Characterization of the antisense-GFAT transgenic mice. (A) (Left) The schematic diagram of the transgene. (Right) The PCR analysis of DNA derived from the tails of F1 mice (lanes 2 and 4 are gene positive). M1: 1-kb markers; M2: 100-bp markers; P: 0.5 pg plasmid DNA template. The expected amplified target sequence is about 1.28 kb. (B) In situ hybridization of a transgenic mouse pancreas. The adjacent tissue slices, mounted on microscope slides, were exposed to x-ray film for 3 days. (Left) The probe was antisense insulin. (Inset) A photomicrograph of the hematoxylin/eosin-stained islets corresponding to the hybridization signal. (Right) The probe was sense GFAT indicating the location and intensity of expression of the antisense transgene (magnification: ×3). (C) In situ hybridization of a wild-type mouse pancreas. The adjacent tissue slices, mounted on microscope slides, were exposed to x-ray film for 3 days. (Left) Probing for insulin mRNA. (Right) Probing for the endogenous GFAT mRNA (magnification: ×3). (D) The effect of the antisense GFAT transgene on the β cell O-GlcNAc accumulation in hyperglycemic mice. The mice were injected with STZ followed by glucose, and the pancreas was examined by immunohistochemical staining with RL2 antibodies. (Left) The pancreas from a wild-type littermate mouse after receiving treatment with STZ and glucose (blood glucose = 14 mM) (magnification: ×400). (Right) The pancreas from a RIP-mGFAT(AS) transgenic mouse after receiving treatment with STZ and glucose (blood glucose = 19 mM).

