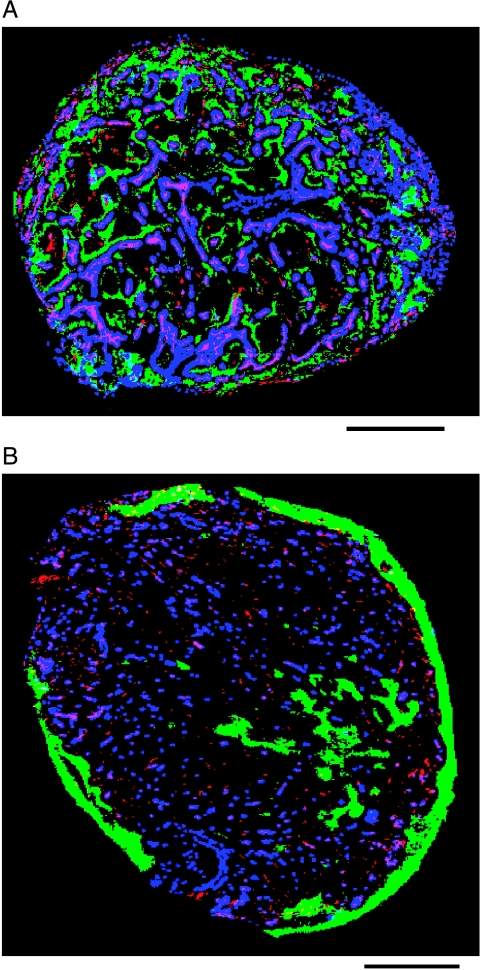
Figure 1.
Binary image of complete tumor sections of C38 (A) and C26a (B) colon tumors showing the pattern of vascular architecture (stained with 9F1, which is a rat monoclonal to the mouse endothelium), perfused vessels (Hoechst33342 staining), and hypoxic profile (pimonidazole staining). Vascular structures, red-pink; perfused vessels, blue; hypoxic areas, green. The solid line indicates 1 mm. For further details on the immunohistochemical methods used, refer to Van Laarhoven et al. [14].

