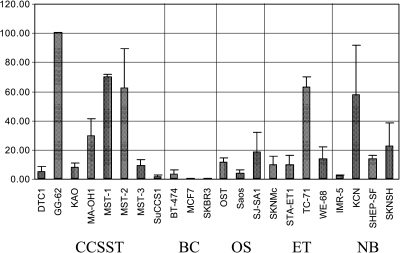
Figure 3.
Real-time qRT-PCR to determine the relative expression of neuregulin-1 in CCSST, BrCa, OS, ET, and NB. For statistical calculation, expression values were categorized as higher or lower than the average. Error bars indicate the SD of independent replica (n = 2). The cell line showing the highest expression (GG-62) was assigned to 100%.

