Figure 3.
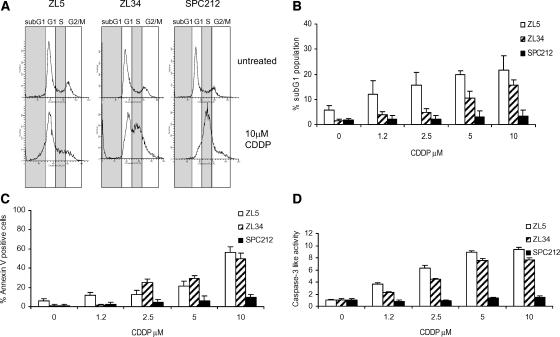
CDDP induces apoptosis in MPM cell lines. (A) Flow diagrams of untreated cells or of cells treated with 10 µM CDDP, fixed, and stained with PI. Panels represent the proportion of cells in different phases of the cell cycle. Representative data of three independent experiments are shown. (B, C, and D) Cells were incubated with the indicated concentrations of CDDP for 48 hours. Standard error bars represent the standard deviation of triplicate samples. (B) Percentage of apoptotic cells in sub-G1 as measured by PI staining and flow cytometry. (C) Percentage of apoptotic cells as measured by Annexin V-FITC staining and flow cytometry. (D) The caspase-3-like protease activity in cell lysates was calculated as fold increase of the absorbance signal obtained with lysates of untreated cells.

