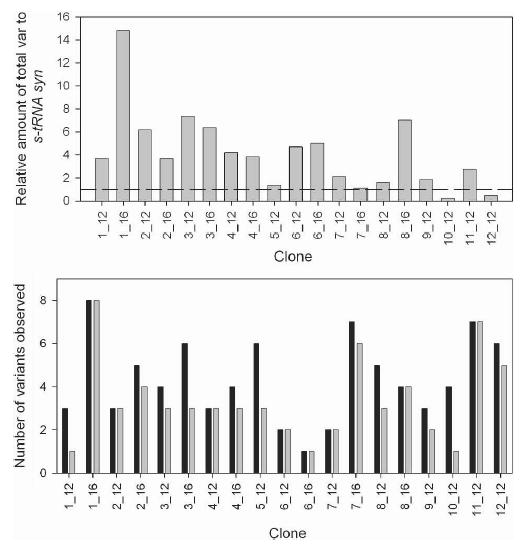
Figure 2.

Comparison of (A) the total quantity of var transcripts measured in the real-time RT-PCR relative to the endogenous control and (B) the number of transcripts detected using RT-PCR (black) and real-time RT-PCR (gray) in each clone. In A, the dashed line represents the transcription level of the endogenous control s-tRNA syn. For all clones except 5_12, the number of specific var primers tested in the real-time RT-PCR equaled the number of variants observed in the RT-PCR. For clone 5_12 only, five specific var primers were used.
