
Figure 14.
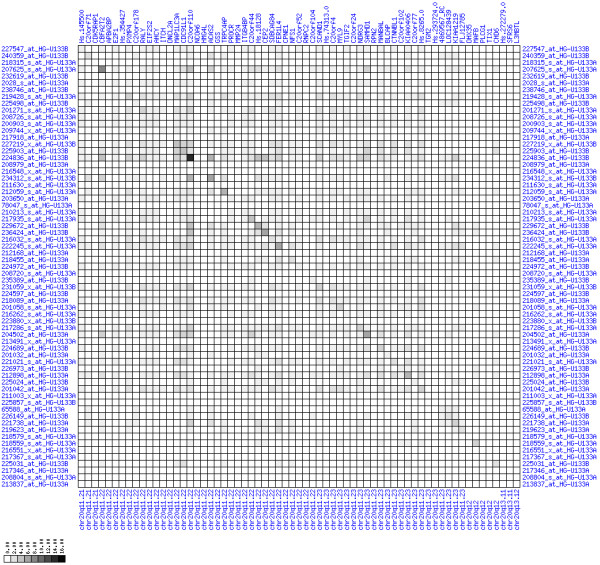
Up-regulation of mRNA expression in human chromosomal region 20q11.22-q11.23 (patient counts with coordinate down-regulation). Grayscale plot of cross-comparison of down-regulation patterns across patients for gene pairs in a particular region. Both, horizontal and vertical axes comprise the same genes in chromosomal order. In each square total counts of patients with consistent down-regulation in two genes are coded by different shades of gray. Dark squared regions along the diagonal indicate coordinated regulation in patient subgroups. View in conjunction with Figures 12 and 13.