
Figure 17.
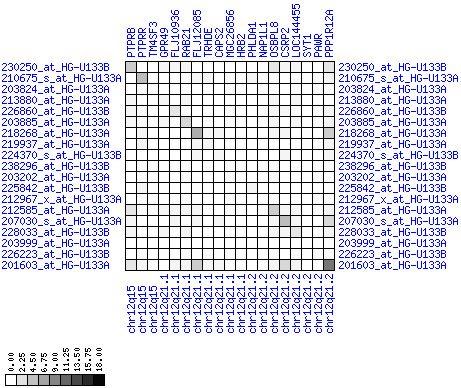
Up-regulation of mRNA expression in human chromosomal region 12q21.1-q21.2 (patient counts with coordinate down-regulation). Grayscale cross-comparison plots of down-regulation patterns across patients (analogous to Figures 8, 11, 14). View this plot in conjunction with Figures 15 and 16.