
Figure 31.
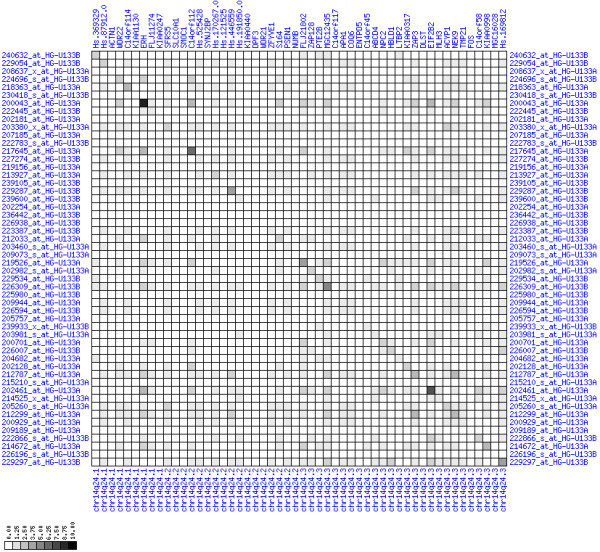
Down-regulation of mRNA expression in human chromosomal region 14q24.1-14q24.3 – the FOS region (patient counts with coordinate up-regulation). Grayscale cross-comparison plot of up-regulation patterns across patients (analogous to Figures 7, 10, 13). View this plot in conjunction with Figures 30 and 32.