
Figure 9.
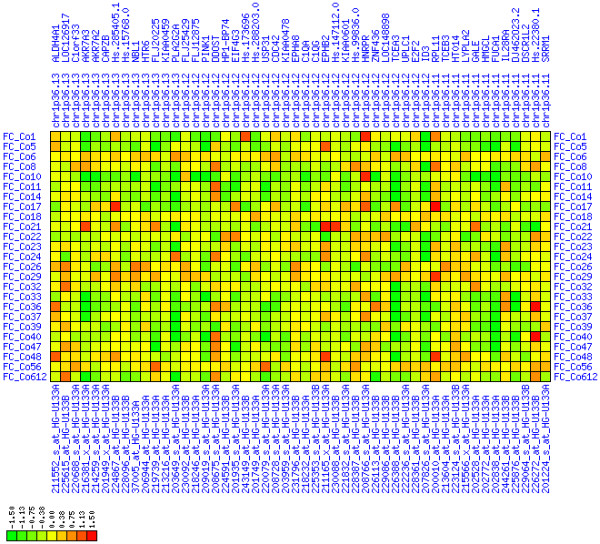
Down-regulation of mRNA expression in human chromosomal region 1p36.13-1p36.11 (T/N relative expression heat map). Heat map of fold change of tumor-versus-normal expression. Genes are given in chromosomal order on the horizontal axis. Patient codes are given on the vertical axis. The legend depicts which colors code for which expression changes on a loge scale (green: down in tumor; red: up in tumor). View in conjunction with Figures 10 and 11.