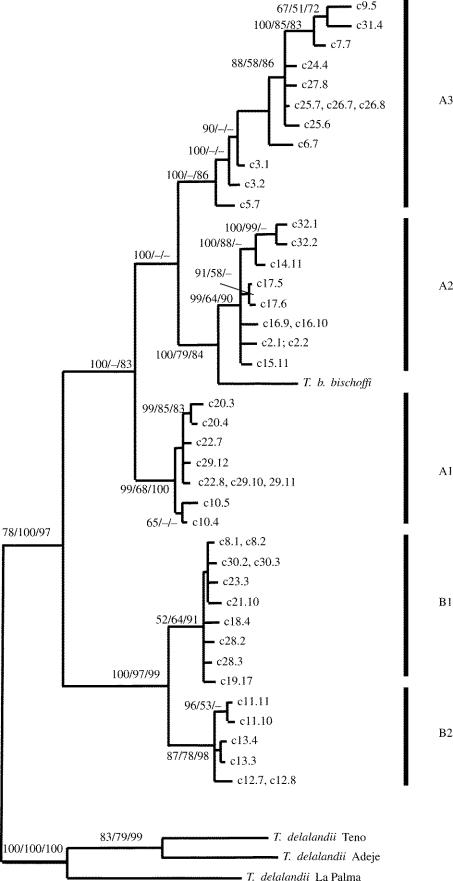
Figure 1.
Bayesian phylogram of T. boettgeri mitochondrial (mt) haplotypes. Samples from Gran Canaria are marked with ‘c’, the following number gives the locality number, the number after the dot gives specimen number. Outgroups are T. delalandii from Teno, Adeje area and La Palma. Major clades are indicated by bars. Numbers on branches (≥65) give Bayesian posterior probabilities and bootstrap values for ML and MP reconstruction, respectively.

