
Figure 4.
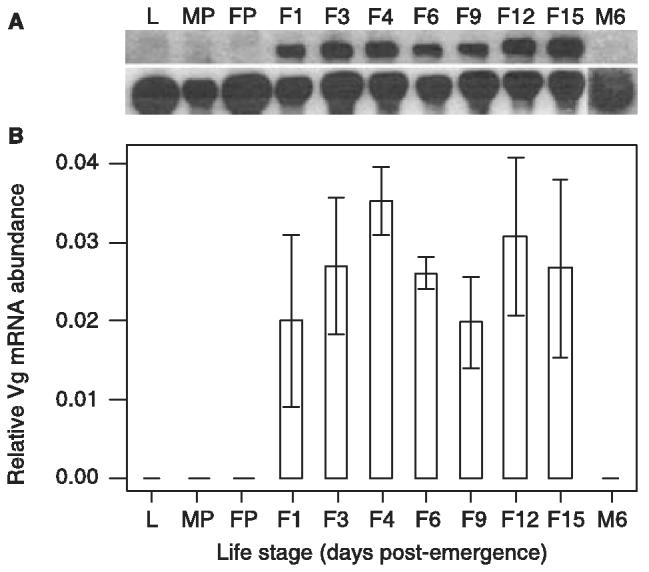
Profile of Vg mRNA abundance at various life stages of T. molitor. (A) Northern blot analysis of total RNA from larvae (L), male pupae (MP), female pupae (FP), fat body tissue from non-infected females at various days post-emergence (F1–F15) and fat body tissue from males at 6 days post-emergence (M6). Ten micrograms of total RNA was fractionated on denaturing 1% agarose-formaldehyde gels and transferred onto Hybond-N+ membrane. The membrane was probed with a 3′ Vg cDNA fragment (upper panel) and 18S internal control (lower panel). (B) Relative abundance of Vg mRNA following normalization to the 18S internal control for the life stages described above. For F4–F15, Vg mRNA abundance was determined from the fat bodies of six individuals and for other samples, fat bodies from two individuals were used. Bars represent the mean ± standard error.