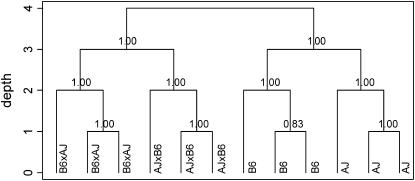
Figure 1.—
Hierarchical cluster of the 12 mice samples. The samples were clustered on the basis of 6148 genes significantly differently among the 12 samples at FDR 0.001. The number at each branch represents the percentage of times the subbranches cluster together in bootstrapping analysis. Depth is the level of branching.

