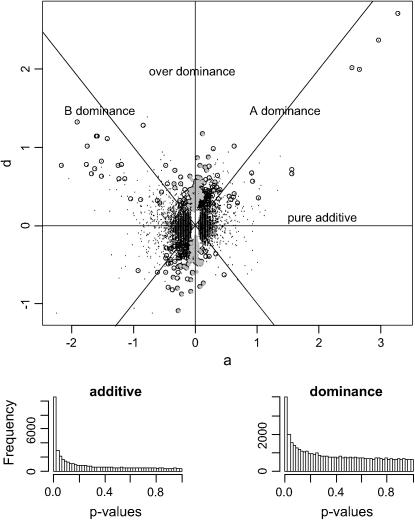
Figure 4.—
Estimating and testing for additive and dominance effects. (Top) The estimated additive (a) and dominance (d) effects for the F1 hybrid A × B. Genes that show significant additive effect are represented by solid dots and genes that show significant dominance effect are represented by open circles. Genes on the horizontal line show pure additive effect. Genes on the vertical line show pure dominant effect (overdominance). The line with slope of 1 represents A allele dominant and the line with slope of −1 represents B allele dominant. Shaded diamonds represent genes that show significant overdominance effect. Significance level is FDR 0.05 for all tests. (Bottom) Histograms of P-values obtained from testing for additive and dominance effects in the top. The excess of low P-values indicates the presence of significant genes.

