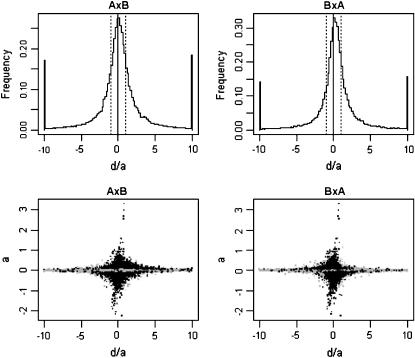
Figure 5.—
Degree of dominance. The dominance effect, d, is computed as the difference between the mean of a F1 hybrid and the mean of the parental strains. The additive effect a is computed as half of the difference between the two parental strains. (Top) Histograms of the degree of dominance for the two F1 hybrids. The solid vertical line indicates no dominant effect. The two dotted vertical lines represent that F1 is equal to one of the parental strains (full dominant). Left dotted line represents AJ and the right dotted line represents B6. The spikes at −10 and 10 represent the frequency of all transcripts with  and
and  , respectively. (Bottom) The relationship between the additive effect and the degree of dominance. Small additive effects cause a large degree of dominance represented by the tight distribution along the
  line. Solid points represent the genes that show significant genetic effect at significance level of FDR 0.01 and the shaded points represent genes with no significant genetic effect.

