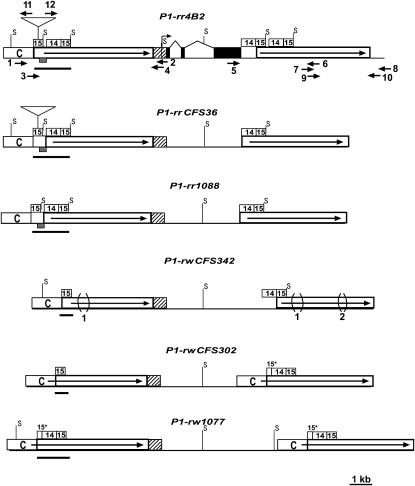
Figure 2.—
Structural comparisons of the simplex p1 alleles. The solid boxes connected by thin lines represent exon regions. The open boxes with solid arrows indicate long direct repeats in 5′ and 3′ noncoding regions. The bent arrow represents a transcription start site (Grotewold et al. 1991). The hatched boxes represent 5′-UTR and 90-bp promoter regions conserved among the p1 alleles. The open boxes labeled with C indicate a 1.1-kb region, termed fragment C, present at the 5′ direct repeats of all p1 alleles, but absent from the 3′ direct repeats in several p1 alleles. The numbered open boxes represent the sequences identified in the text as fragment 15 and fragment 14. The enhancer-containing regions in each p1 allele are highlighted by solid bars, which range from 1.6 kb (in the P1-rr alleles) to 602 bp (in the P1-rwCFS302 and P1-rwCFS342 alleles). The cob glume-specific regulatory region is indicated as shaded boxes in the enhancer-containing regions of the P1-rr alleles (which include the 189-bp sequence from fragment 15 and the 197-bp immediate downstream sequence). The regions marked 15* indicate partial fragment 15 sequences, which contain only the first 200 bp fragment 15 sequences. The triangles located in the first copy of fragment 15 in the 5′ noncoding repeats of P1-rr4B2 and P1-rrCFS36 represent insertions of a 1.6-kb transposon-like sequence. The bracketed regions marked 1 and 2 indicate 549- and 148-bp deletions, respectively, in the noncoding repeats of P1-rwCFS342. The solid arrows represent primers used to amplify 5′ and 3′ noncoding regions of p1: 1, P1rr-18; 2, PA-B4; 3, P1rr-14; 4, PA-B6; 5, EP5-16; 6, P1rr-16; 7, P1rr-13r; 8, P1rr-30; 9, P1rr-16r; 10, P1rr-29; 11, P1rr-32; and 12, P1rr-25. Positions of the restriction site, SalI, are shown on each p1 allele (only unmethylated SalI sites that flank fragment 15 are indicated on the map).

