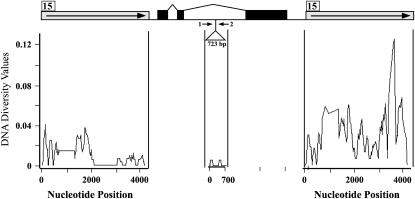
Figure 4.—
Nucleotide diversity analysis of noncoding regions at the p1 locus. Open boxes with solid arrows represent the 5′ and 3′ noncoding direct repeats. The position of fragment 15 is indicated with the numbered box. The solid boxes connected with thin lines represent the exon and intron structure of the p1 locus. The triangle in the second intron indicates the 723-bp sequence that is also subject to nucleotide diversity analysis. The solid arrows represent the primers for amplification of the 723-bp region: 1, 723-5; 2, 723-3.

