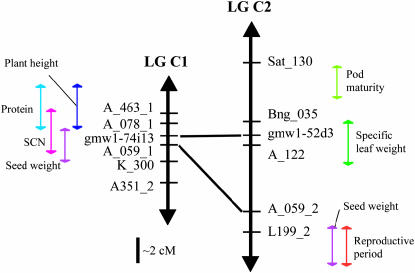
Figure 1.—
Map position of BACs gmw1-74i13 and gmw1-52d3 relative to the soybean composite map, linkage groups C1 and C2. Mapping of the BACs was based upon SSRs found in each BAC sequence. Lines show homeologous relationships between markers on these linkage groups. QTL are represented as colored arrows next to the linkage groups.

