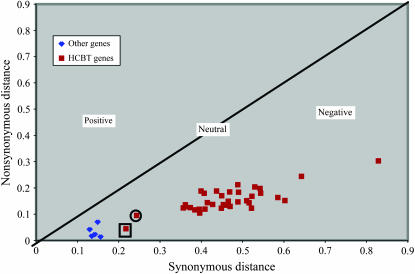
Figure 3.—
A plot of synonymous distance vs. nonsynonymous distance for all soybean homeologous gene pairs. All red squares correspond to HCBT gene alignments while blue diamonds represent all other homeologs between the soybean BACs gmw1-74i13 and gmw1-52d3. The circled square corresponds to synonymous and nonsynonymous distances between gmw1-74i13, gene 7 (HCBT 4), and gmw1-52d3, gene 7 (HCBT 3). The blocked square similarly corresponds to gmw1-74i13, gene 5 (HCBT 2), and gmw1-52d3, gene 6 (HCBT 2).

