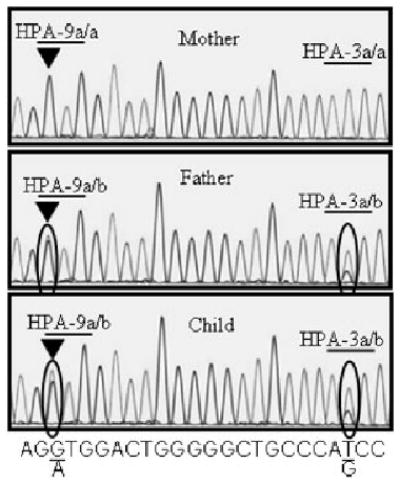
Fig. 2.

Sequence analysis of the HPA-9 (Max) locus in Family 4. PCR products generated with primers n25S and n25A were subjected to automated sequence analysis with primer n25S (see Table 1). DNA of father and child had both A and G nucleotides at position 2602 (encircled, left) indicating heterozygosity for HPA-9b (Maxa). Mother’s DNA contained only G at this position. Father and son both had both T and G at position 2621 (encircled, right) indicating heterozygosity for HPA-3a/b (Baka/b), whereas the mother had only T at this position, indicating that her genotype was HPA-3a/a (Baka/a).
