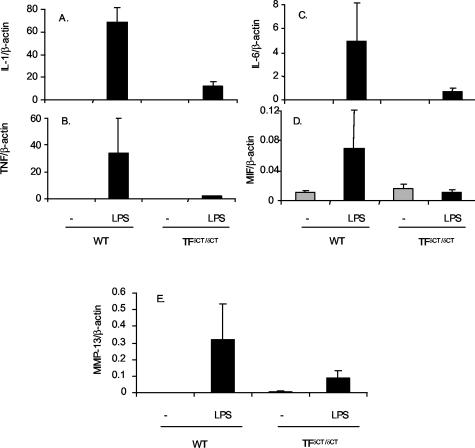
Figure 8.
Peritoneal macrophage cytokine mRNA levels from TFδCT/δCT and TF+/+ (WT) mice with AIA. Total RNA extracted from peritoneal cells of mice was reverse-transcribed. cDNA samples were amplified using real-time quantitative PCR and SYBR Green detection as described. The relative amounts of IL-1β, TNF, IL-6, MIF, and MMP-13 to β-actin determined from standard curve are expressed by ratio in TF+/+ (WT) (n = 4) and TFδCT/δCT mice (n = 4). Results are expressed as means ± SEM.

