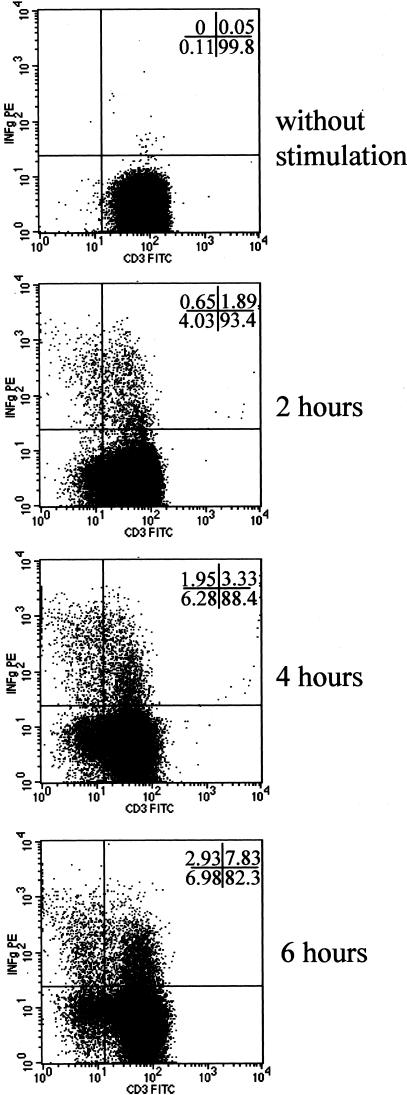
Figure 3.
Kinetic of CD3 and IFN-γ expression on CD4+ T cells after oligoclonal activation with SEB. Using a FACS analysis, the CD3 kinetics (detected with anti-CD3-fluorescein isothiocyanate) were evaluated from 0 to 6 hours on SEB stimulation on CD4 T cells in combination with IFN-γ staining (detected with anti-IFN-γ-PE). The dot-plots display CD3 versus IFN-γ staining gated on CD4+ cells isolated from PBMCs stimulated from 0 to 6 hours. The loss of CD3 expression on CD4+ T cells is time-dependent and associated with that of IFN-γ apparition.

