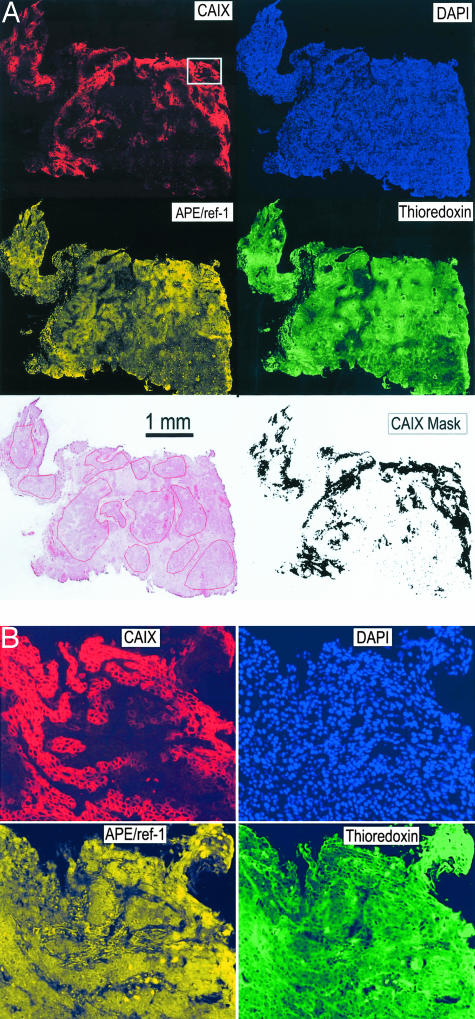
Figure 2.
A: Representative composite, quadruple fluorescence images obtained from a patient sample. The images have been contrast-enhanced for visual inspection. The H&E image was obtained from a serial section using a slide scanner, and the areas of viable tumor tissue analyzed are drawn on this image. The CAIX gray-scale image was converted to a binary image, filled using a dilation/erosion technique, and used as a mask to identify hypoxic regions for measurements of thioredoxin and APE/ref-1 (bottom right). B: Higher power view of the area indicated by the rectangle on the CAIX image in A. Original pixel resolution.

