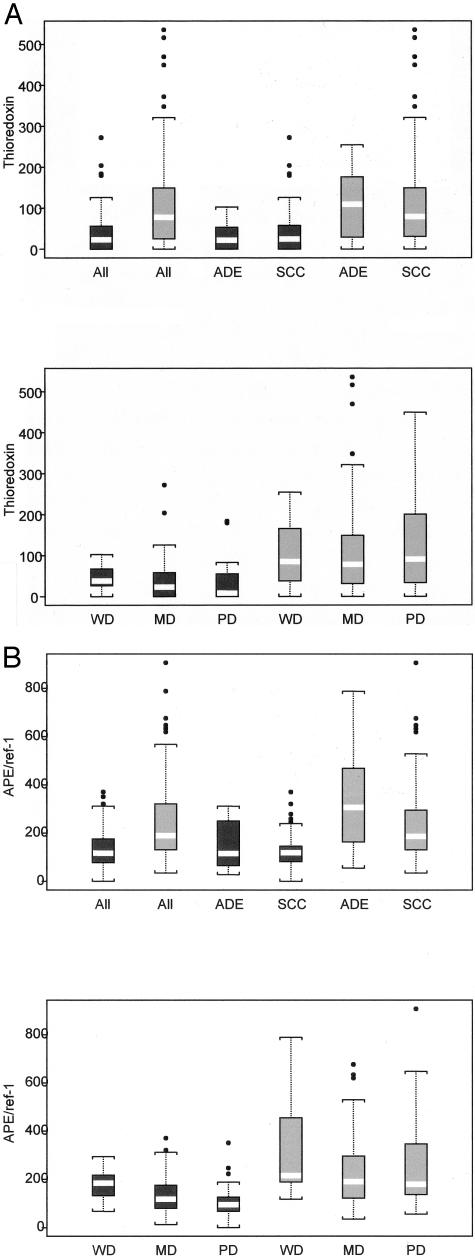
Figure 3.
Box plots of thioredoxin (A) and APE/ref-1 (B) levels in CAIX-positive (gray boxes) and -negative (black boxes) areas of 110 patient biopsies. The white bars indicate the median values, and the bottom and top edges of the rectangles represent the first and third quartiles. The length of the lines drawn outside the boxes is 1.5 × the interquartile range. Tumors are subdivided based on adenocarcinomas (ADEs) versus squamous cell carcinomas (SCCs), and according to histological grade: well differentiated (WD), moderately differentiated (MD), and poorly differentiated (PD).

