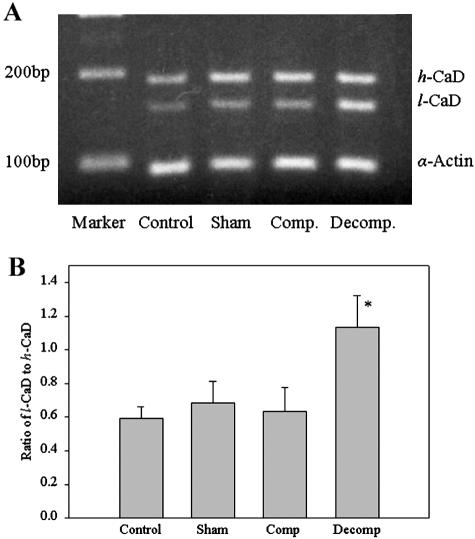
Figure 6.
RT-PCR analysis of h-CaD and l-CaD in different bladder groups. A: PCR products separated on a 2% agarose gel. The high and low molecular size fragments representing the h- and l-CaD cDNA are shown. The α-actin was used as an internal control. B: Mean (+SEM) ratios of l-CaD to h-CaD from scanning densitometric analyses. * P < 0.05.

