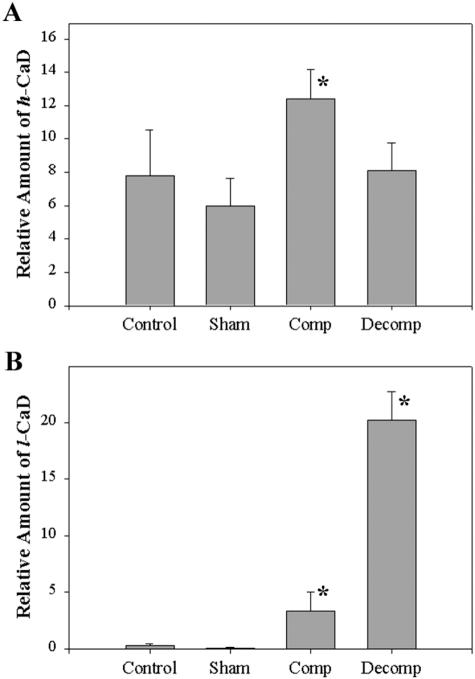
Figure 9.
Relative amounts of h- and l-CaD in the extracts of detrusor smooth muscles from normal, sham, compensated, and decompensated bladders. Western blots were scanned using a scanning densitometer and the areas under the bands were determined. The loadings were adjusted to contain sufficient amounts of CaD for the absorption to fall within the linear portion of the standard curve of protein concentration versus absorption in the Western blots using varying concentrations of pure CaD. Relative amounts of h-CaD and l-CaD were calculated as means + SEM. *, P < 0.05.

