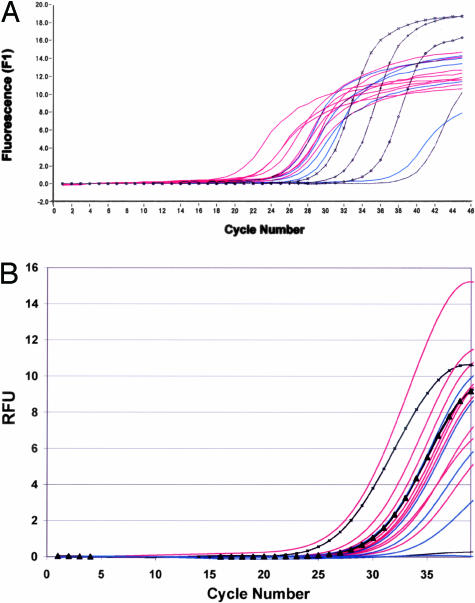
Figure 10.
RT-PCR of 21-day rat subdermal explants. Amplification plots of TNC (A) and MMP-9 (B) from real-time PCR studies for comparison of TGA-pretreated implants (blue) versus Glut-pretreated implants (red) as compared to gene-specific standards. The copy number in each sample was calculated by comparison to the inflection point of each gene-specific copy number standard (black square,104; black x,103; black triangle,102; black diamond,101; black line, negative control). A: TNC expression is down-regulated in vivo at the mRNA level in TGA-pretreated implants (blue) versus Glut-pretreated implants (red), as demonstrated by the relative inflection points and calculated copy numbers (see text, P = 0.016). Parallel RT-PCR analyses for MMP-9 mRNA (B) showed a statistically insignificant trend for down-regulation of MMP-9 per mRNA results from TGA-pretreated explants (blue) per real-time PCR results compared to Glut-pretreated explants (red).

