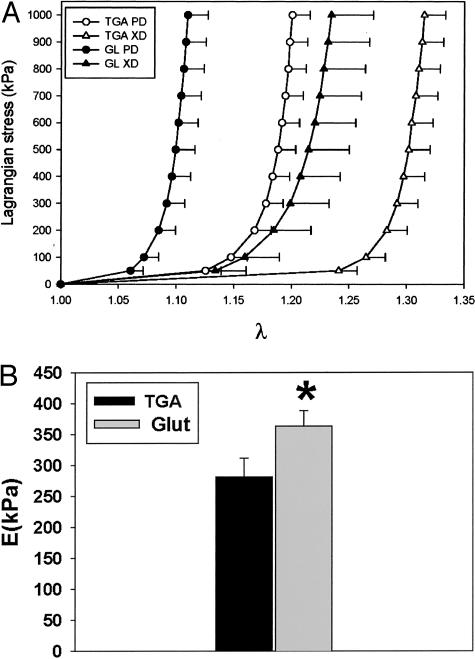
Figure 4.
Biomechanical testing of TGA- and Glut-crosslinked pericardium. A: The average equi-biaxial stress-strain curves for TGA and Glut specimens, with the error bars indicating 1 SEM (n = 10 for TGA and n = 8 for Glut). B: Mean flexural stiffness results for TGA- and Glut-treated pericardium. GLUT-treated pericardial samples were ∼25% stiffer than TGA-treated tissues. *, P = 0.03 from the TGA value, and the error bars indicate 1 SEM.

