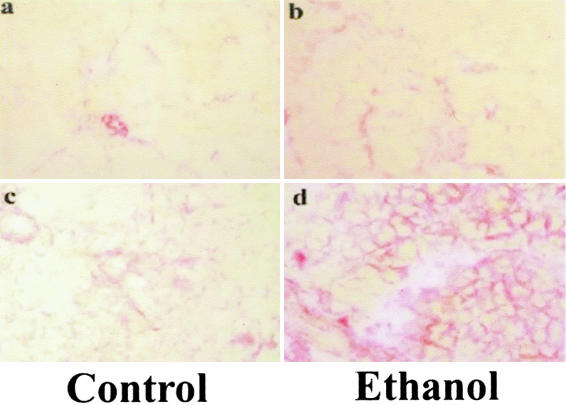
Figure 9.
Representative tissue sections stained by Sirius Red. a: Control vehicle-treated group (CP0); b: ethanol vehicle-treated group (EP0); c: 96-hours three episodes of cerulein pancreatitis in control-fed group (CP3); and d: 96-hours three episodes of cerulein pancreatitis in alcohol-fed group (EP3). Sirius Red stain. Original magnifications, ×100.

