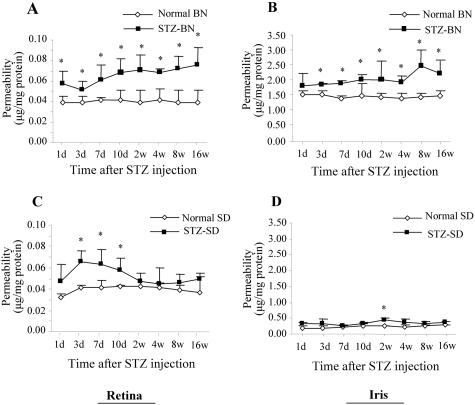
Figure 1.
Time courses of vascular hyperpermeability in BN and SD rats with STZ-induced diabetes. After intravenous injection of STZ (50 mg/kg), vascular permeability in the retina (A and C) and iris (B and D) was measured using the Evans blue method. Vascular permeability was measured at 1, 3, 7, and 10 days, and at 2, 4, 8, and 16 weeks after the STZ injection. Age-matched normal rats of each strain were used as controls. Evans blue was normalized by total protein concentration in the tissue. Permeability is expressed as μg of dye per mg of protein in the tissue (mean ± SD, n = 4 to 7). Values statistically different from the control are indicated by * (P < 0.05).

