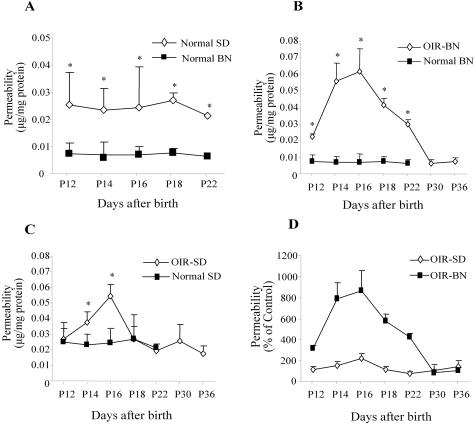
Figure 2.
Time courses of vascular hyperpermeability in the retina of BN and SD rats with OIR. Rats were exposed to 75% O2 from age P7 to P12 and then returned to normoxia. Vascular permeability was measured at P12, P14, P16, P18, P22, P30, and P36 in OIR rats and in normal controls. A: Comparison of basal levels of RVP between normal BN and SD rats, RVP in OIR and normal BN rats at different ages (B), and RVP in OIR and normal SD rats at different ages (C). The Evans blue in the retina was normalized by total protein concentration. The result is expressed as μg of dye per mg of protein in the retina (mean ± SD, n = 4 to 7). Values statistically different from the respective controls are indicated by * (P < 0.05). D: Comparison of the increases of RVP in BN and SD rats with OIR. Values are expressed as percent increases of permeability over the respective controls (mean ± SD, n = 4 to 7).

