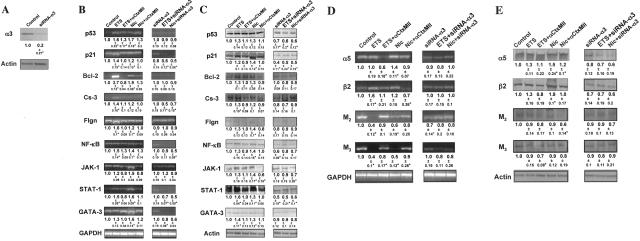
Figure 1.
Gene expression changes in human KCs exposed to ETS or pure Nic. Total RNA and proteins were isolated from intact or siRNA-α3-transfected human KCs exposed for 6 hours per day for 5 consecutive days to ETS or 10 μmol/L Nic. The relative amounts of mRNA transcripts and protein levels of the regulatory molecules p53, p21, Bcl-2, caspase-3 (Cs-3), NF-κB, JAK-1, STAT-1, GATA-3, the differentiation markers filaggrin (Flgn), the α5 and β2 nAChR subunits, and the M2 and M3 mAChR subtypes were measured, and the results expressed as described in the Materials and Methods section. Asterisks indicate significant (P < 0.05) differences from control. A: Representative results of WB analysis of the effect of siRNA-α3 on α3 nAChR subunit expression in human KCs. The numbers underneath the bands are ratios of the densitometry value of α3 subunit to that of β-actin, compared to the values obtained in control KCs (taken as 1). B and D: RT-PCR analysis of ETS and Nic effects on gene expression in human KCs. Gene-specific RT-PCR primers were designed to amplify the human p53, p21, Bcl-2, Cs-3, Flgn, NF-κB, JAK-1, STAT-1, and GATA-3 (B), or α3 and β2 nAChR subunit, or M2 and M3 mAChR subtype (D) genes (Table 1). To standardize the analysis, the gene expression ratios in the control cells, ie, intact KCs in experiments with αCtxMII (shown on the gels) and KCs transfected with a nonspecific siRNA in experiments with siRNA-α3 (not shown), were taken as 1. The ratio data underneath the bands are the means ± SD of the values obtained in at least three independent experiments. The images show representative bands in gels. C and E: WB analysis of ETS and Nic effects on gene expression in human KCs. After the exposure experiments described in the B and D, the protein levels of KC p53, p21, Bcl-2, Cs-3, Flgn, NF-κB, JAK-1, STAT-1, and GATA-3 (C), or α3 and β2 nAChR subunits, or M2 and M3 mAChR subtypes (E) were analyzed by WB. The gene expression ratio of 1 was assigned to control KCs, as explained above. The ratio data are the means ± SD of the values obtained in at least three independent experiments. The images show typical bands appearing at the expected molecular weights (Table 4). Specific staining was absent in the negative control experiments in which the membranes were treated without primary antibody or with irrelevant primary antibody of the same isotype and host (not shown).

