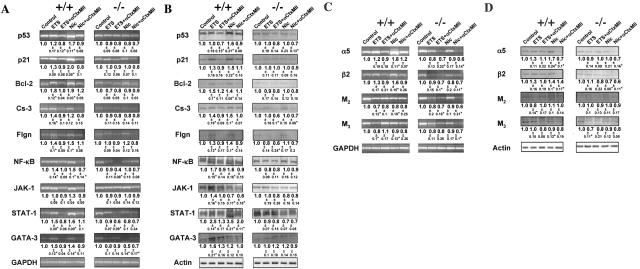
Figure 3.
Null mutation of α3 nAChR subunit abolishes ETS- and Nic-dependent changes in KC gene expression in in vitro experiments. Monolayers of murine KCs were established from the oral mucosa of neonatal α3+/+ and α3−/− mice and grown to ∼70% confluence in KGM, after which the monolayers were exposed to ETS or Nic as detailed in Materials and Methods. Asterisks indicate significant (P < 0.05) differences from control. A and C: RT-PCR analysis of ETS and Nic effects on gene expression in exposed α3−/− murine KCs. Gene-specific RT-PCR primers were designed to amplify the murine p53, p21, Bcl-2, Cs-3, Flgn, NF-κB, JAK-1, STAT-1, and GATA-3 (A), or α3 and β2 nAChR subunit, or M2 and M3 mAChR subtype (C) genes (Table 2). To standardize analysis, the gene expression ratio in α3+/+ KCs was taken as 1. The ratio data underneath the bands are the means ± SD of the values obtained in at least three independent experiments. The images show representative bands in gels. B and D: WB analysis of ETS and Nic effects on gene expression in exposed α3−/− murine KCs. The KC proteins under consideration were visualized by primary antibodies (Table 4) using the WB procedure described in detail in the legend to Figure 1, C and E. The gene expression ratio of 1 was assigned to α3+/+ KCs. The ratio data underneath the bands are the means ± SD of the values obtained in at least three independent experiments.

