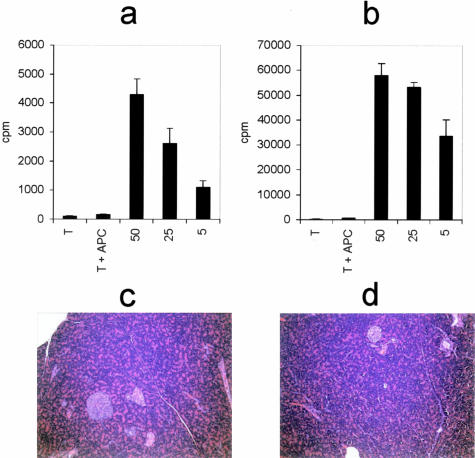
Figure 5.
DA(RP) anti-CAII (a) and anti-LF (b) T cells were evaluated for antigen specificity in a proliferation assay using syngeneic antigen-presenting cells and varying concentrations of antigen. Vertical axes represent the 3H-thymidine incorporation in dividing cells. Results are displayed as cpm ± SD. c: Histological section of a pancreas from a DA(RP) rat given anti-CAII cells. d: Histological section of a DA(RP) rat given anti-LF cells. Original magnifications, ×20.

