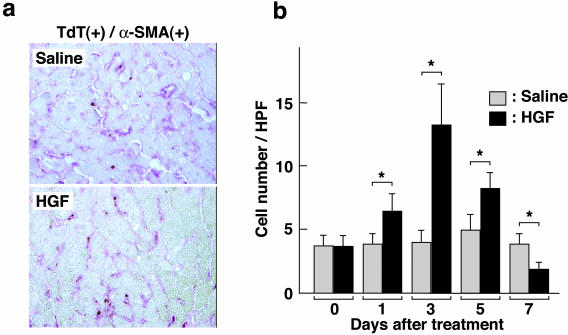
Figure 5.
Distribution and changes in apoptotic liver myofibroblasts in cirrhotic livers in rats untreated and treated with HGF. a: Distribution of apoptotic α-SMA-positive cells in liver sections obtained from cirrhotic livers on day 3 after HGF treatment. α-SMA-positive cells were detected by immunostaining (red) and apoptotic cells were detected using TUNEL staining (brown). b: Change in the number of apoptotic α-SMA-positive cells after HGF treatment. The number of cells double-positive for α-SMA and TUNEL staining was determined in liver sections. Rats were subjected to DMN administration for 5 weeks, followed by daily administration of HGF. Each value represents the mean ± SD (n = 8). *, P < 0.05. Original magnifications, ×200.

