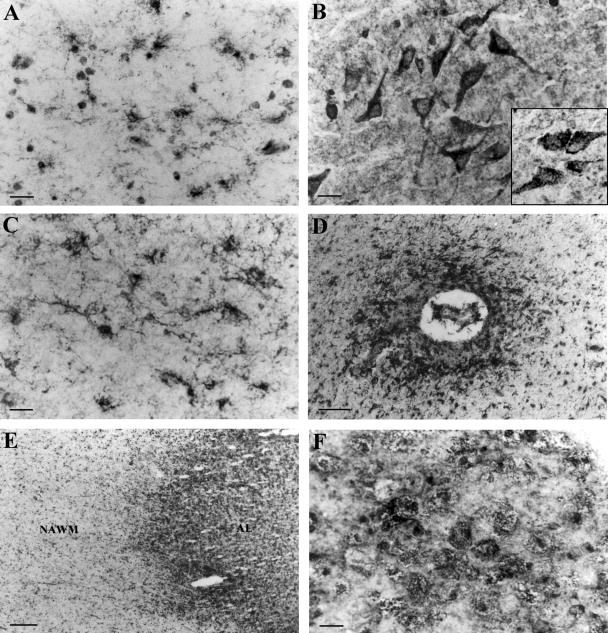
Figure 4.
Immunolocalization of LRP in control and MS brains. Staining of control white matter showing positive microglia (A) and control gray matter showing positive neuronal perikarya (B). Inset in B shows RAP-positive neurons in control gray matter. C and D: LRP-positive activated microglia in NAWM parenchyma (C) and clustered around a blood vessel (D) in NAWM. E: Low-power photomicrograph of an AL and adjacent NAWM stained with anti-LRP antibody. F: High magnification of the lesion border showing staining of foamy macrophages. Scale bars: 20 μm (A–C, F); 320 μm (E); 50 μm (D).

