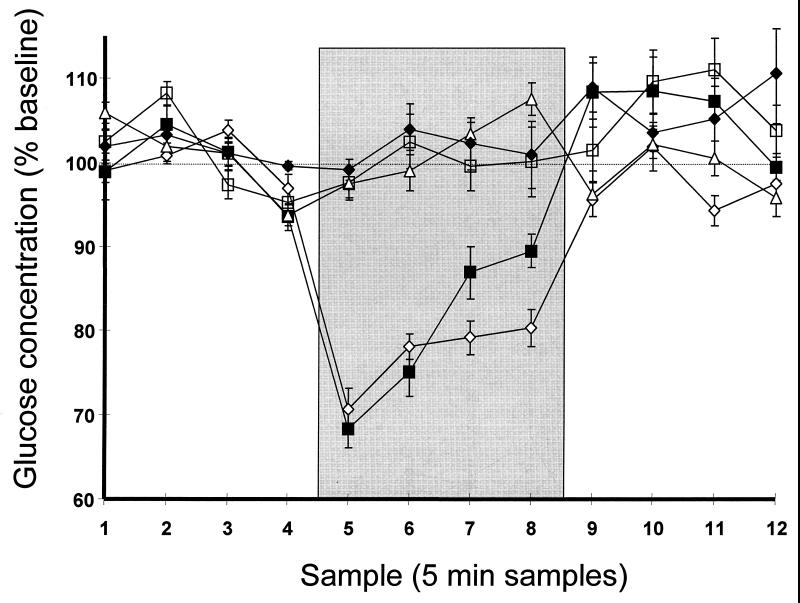
Figure 1.
Mean extracellular hippocampal glucose concentrations during +-maze testing, expressed as a percentage of baseline concentration. Samples 1–4 are pretesting baseline; samples 5–8 (shaded area) are during testing for those groups tested; samples 9–12 are posttesting. All rats were handled between samples 4 and 5 and between samples 8 and 9, whether or not being tested on the maze. □, Control group (no treatment, no testing); ⋄, +-maze group (no treatment); ■, +-maze saline group (1.0 ml of sterile saline, i.p., 30 min pretesting); ♦, +-maze glucose group (1.0 ml of 250 mg/kg, i.p., 30 min pretesting); ▵, glucose group (no testing, glucose as in +-maze glucose group). Error bars = SEM.

