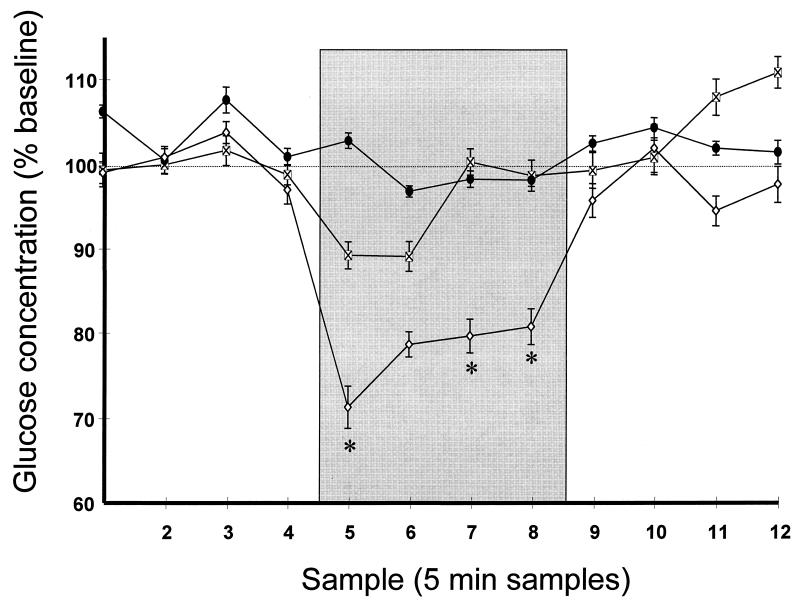
Figure 3.
Mean extracellular hippocampal glucose concentrations (as in Fig. 1), but during Y-maze testing. ⊠, Y-maze group (no treatment); ●, Y-maze glucose group (1.0 ml of 250 mg/kg, i.p., 30 min pretesting); ⋄, +-maze group (no treatment), repeated from Fig. 1 for ease of comparison. Error bars = SEM. ∗, Group difference between Y-maze- and +-maze-tested groups, P < 0.05.

