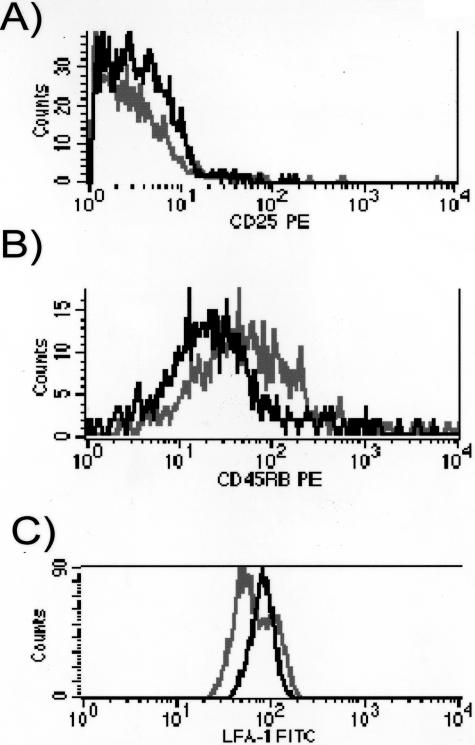
Figure 3.
Activation status of spinal cord T cells after SCI. Histograms show CD25 (A), CD45RB (B), and CD11a (C) expression on CD4-hi (black line) and low (gray line) cells from T/R− mice. CD4-hi cells correspond to the R3 gate in Figure 2A, and CD4-lo cells correspond to the R4 gate in Figure 2A. These data correspond to 2 animals representative of the analysis of 13 animals per group.

