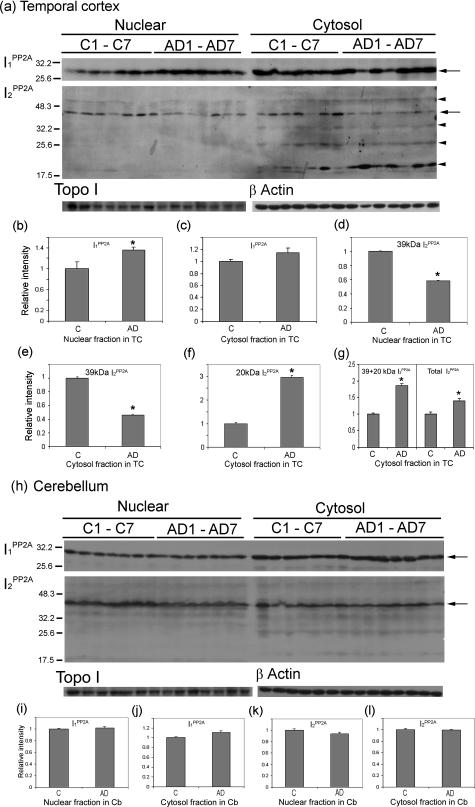
Figure 3.
Cleavage and distribution of I2PP2A in nuclear and cytosolic fractions in AD and control brains. Subcellular fractions from temporal cortex (TC) and cerebellum (Cb) of control (C) and AD cases were analyzed by Western blots. I1PP2A and I2PP2A signals were quantitated using TINA 2.0 software and normalized by topoisomerase I (Topo I) for nuclear fraction and β-actin for cytosol fraction. a–c: In temporal cortex, the level of I1PP2A in AD was increased significantly in nuclear fraction (a, b; *P < 0.05) and insignificantly in the cytosol (a, c) as compared to control cases. In contrast, the level of I2PP2A in the nuclear fraction was decreased in AD as compared to the control cases (a, d; *P < 0.05). The 39-kd I2PP2A in the cytosol fraction was decreased in AD (a, e; *P < 0.05), but an ∼20-kd fragment of I2PP2A was significantly increased in AD as compared to controls (a, f; *P < 0.05). Total relative intensity of both 39-kd plus 20-kd I2PP2A and as well as of the 39-kd plus all its cleavage product polypeptides (total I2PP2A) were increased in AD as compared to control (a, g; *P < 0.05). h: In cerebellum, expression levels of both I1PP2A and I2PP2A were similar in AD and control cases (h–l), and only background level of 20-kd fragment of I2PP2A was seen in cerebellum. b–g, i–l: Mean ± SEM of normalized data relative to control. The left of a and h indicates the molecular weight markers, and on the right of a and h, full-length I1PP2A (30 kd) and I2PP2A (39 kd) is indicated by arrows, and the cleavage products of I2PP2A by arrowheads (from top to bottom, the ∼56-, ∼34-, ∼25-, and ∼20-kd polypeptides).

