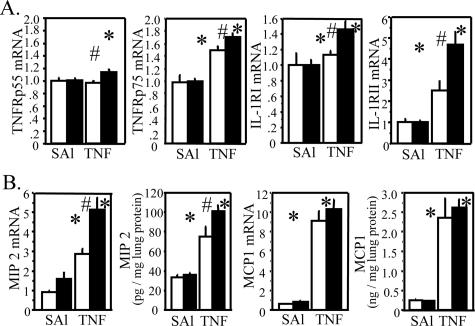
Figure 6.
Increased inflammatory response in TRAF1−/− lung after intratracheal TNF-α. A and B: mRNA encoding TNFRI, TNFRII, IL-RI, and IL-RII (A) and MIP-2 and MCP-1 (B) were measured by ribonuclease protection assays in RNA isolated from lung homogenates of WT (white bars) or TRAF1−/− (black bars) mice, 20 hours after intratracheal treatment. B: MIP-2 and MCP-1 protein were also measured in lung homogenates by ELISA. *, P < 0.001 TNF versus saline-treated strain-specific control; #, P < 0.05 TRAF1−/− versus WT both TNF-α treated. Mean ± SEM, n = 5 to 6.

