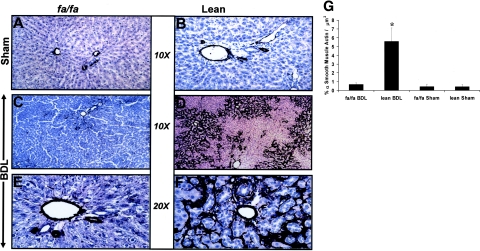
Figure 2.
Low- and high-power magnification of immunohistochemical analysis for α-SMA in lean and fa/fa rats subjected to BDL. A and B: Representative photomicrographs of sham-operated fa/fa and lean littermates reveal α-SMA staining near supporting structures of vessels. C and E: Representative photomicrographs of BDL-operated fa/fa rats at low magnification (C) and high magnification (E) reveal similar staining pattern as in either fa/fa treatment group. D and F: Representative photomicrographs of immunohistochemical staining of BDL-operated lean animals. Low power (D) and high power (F) reveal significant lobular staining for α-SMA. G: Mean percent quantitation of α-SMA-positive cells/total slide area scanned in μm2± SEM for respective animal groups, as described in Materials and Methods. *P < 0.05, compares lean BDL versus sham-operated or fa/fa BDL animals. Original magnifications: ×10 (A–D); ×20 (E, F).

