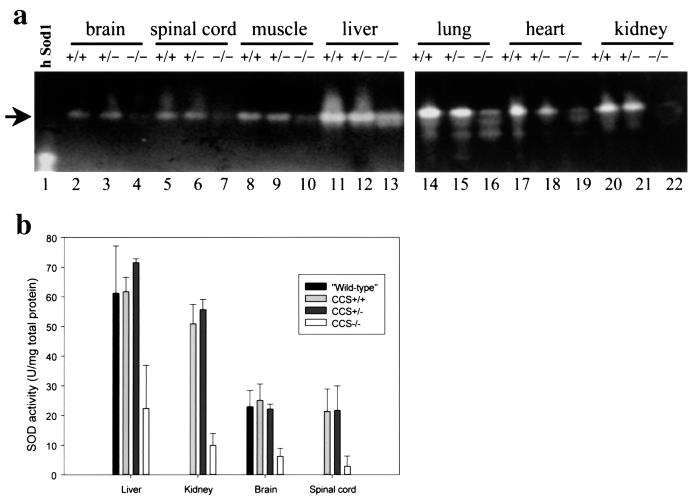
Figure 2.
Diminished SOD1 enzymatic activity in CCS knockout mice. (a) SOD1 activity assay gel of 25 or 50 μg protein extracts, respectively, from brain, spinal cord, muscle, and liver or from lung, heart, and kidney of wild-type (lanes 2, 5, 8, 11, 14, 17, and 20), heterozygous (lanes 3, 6, 9, 12, 15, 18, and 21), and homozygous (lanes 4, 7, 10, 13, 16, 19, and 22) CCS knockout mice. Arrow denote the position of mouse SOD1. Purified human erythrocyte SOD1 is shown in lane 1. (b) SOD1 activity determined from tissue extracts indicated by using a cytochrome c/xanthine oxidase method. The averages of SOD1 activities +/− standard deviations from three mice for each CCS genotype are shown. “Wild-type” values, as previously reported (21), are included for comparison.

